Senior Informix triage, without a senior Informix DBA on call.
The people who can read an Informix engine under load are one of the scarcest skill sets in enterprise IT, and they are retiring faster than they are replaced. This encodes that triage: an agentless diagnostic that reads the engine and the host over one connection, runs 208 vetted probes across 19 diagnostic categories, and returns a ranked report of findings, evidence and remediation. It runs as a multi-server console, and it exposes the same diagnostics over MCP so an AI agent can triage the whole fleet. Read-only, and safe on production.
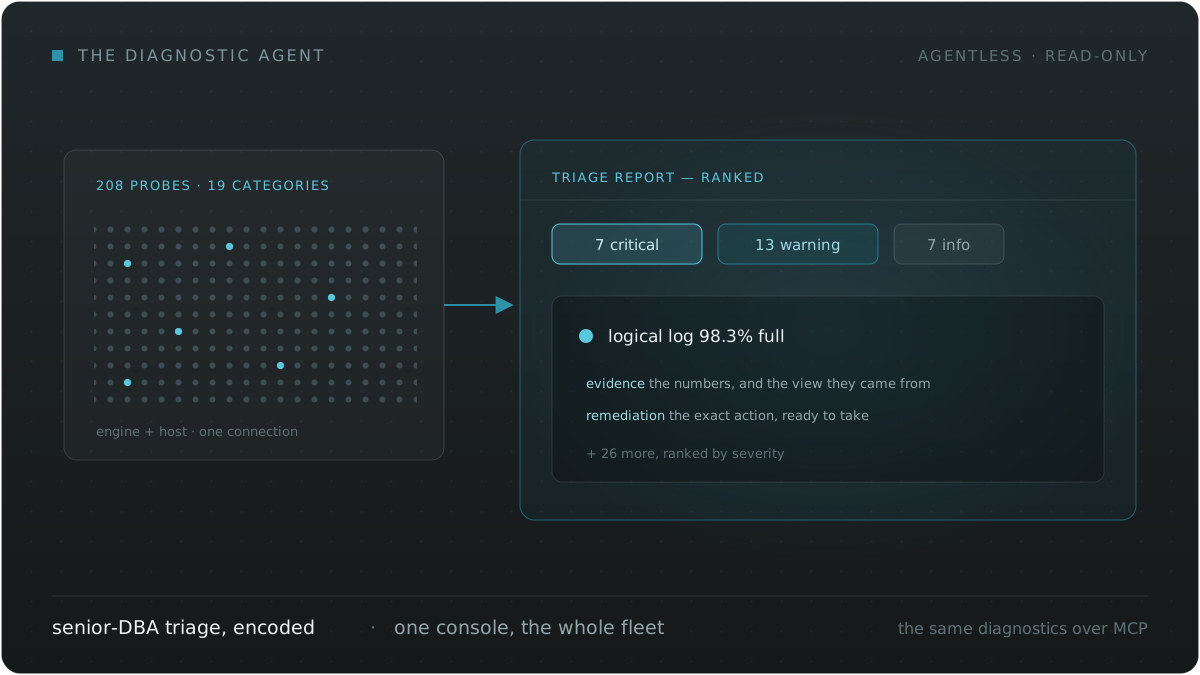
The expertise, encoded
A rules engine reads structured engine metrics and turns them into severity-ranked findings with evidence and a recommendation — the disciplined read a senior DBA performs, on tap rather than on a calendar.
Engine and host, one connection
It reads the engine through the SQL Administration API and the host operating system without SSH — CPU, memory, swap, disk and logs — tunnelled through the single database connection it already has.
208 probes, 19 categories
Two domains, the Informix engine and the host: configuration, memory, sessions and locks, SQL profiling, security posture, backup and replication, and the operating-system layer beneath them.
Agentic over MCP
The diagnostics are exposed as Model Context Protocol tools, gated by OAuth 2.1, so an AI agent can run triage and investigate across every registered server on its own.
The database is not the problem. The skills to run it are.
Informix has quietly run mission-critical transaction systems for a generation. What has changed is not the engine — it is the bench. The senior DBAs who can look at buffer waits, checkpoint behaviour, lock chains and a swapping host and know what to do are scarce, expensive, and retiring; the skill set is hard to hire and harder to keep. When an estate misbehaves, triage still means one of those people logging into the host, running a dozen commands by hand, and correlating the output from memory.
This encodes that work. One connection, one run, one report: the same disciplined read of the engine, the configuration, the storage, the sessions and the host — captured, ranked and explained, so a team that does not have a full-time Informix specialist can still act on what the system is telling them.
What a single run inspects
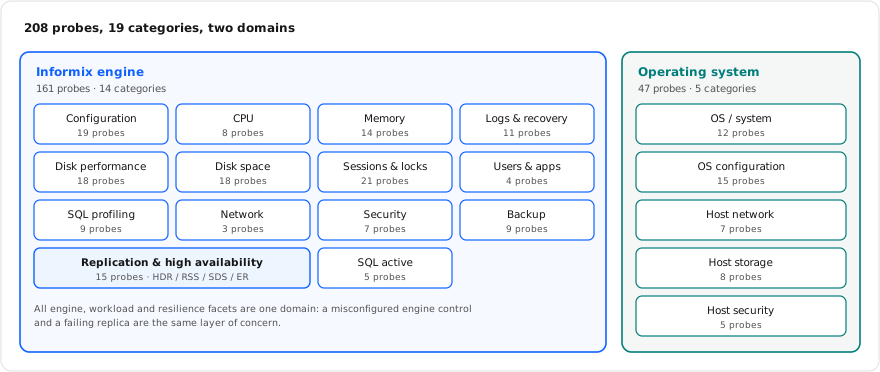
What one run examines
Engine and host, read together and correlated — not a metric dump.
Engine and configuration
Memory, buffers, logging and checkpoint behaviour, and the configuration choices that shape them. Counters are sampled twice so findings report current per-second rates and interval cache hit-rates, not lifetime-since-boot averages.
Storage
Disk performance and disk space read together — dbspaces, chunks, and the I/O behaviour underneath them — so a space warning and a latency problem are seen as one picture.
Sessions, locks and SQL
Blocking chains, lock and latch waits, and per-user and per-application attribution — plus statement-level SQL profiling that captures the costliest statements and their executed plans, flagging where estimated rows diverge from actual.
Host and operating system
The host runtime state without SSH, and the harder question most tools skip: whether the operating system is configured correctly for a database host — kernel shared-memory and semaphore limits, VM tunables, huge pages, async I/O and ulimits.
Security posture
Permission chains, trusted-host authentication, listener and replication encryption, dangerous settings, over-broad grants, and known-CVE exposure for the running engine version — the posture review that rarely gets scheduled.
Resilience
Backup configuration and high availability observed through the same one connection — HDR, Shared Disk and Remote Standalone secondaries and the Enterprise Replication mesh — so a gap in the safety net surfaces before it is needed.
What one run returns
The question every estate asks: who is consuming the machine?
Health is one question; attribution is the harder one. On a server running several thousand statements a second, the CPU and the I/O are being spent by application code — a query issued inside a loop, a statement prepared on every execution, a report that scans where it could seek. Identifying which one requires per-statement measurement, and that is where a database's own instrumentation sets the limit.
Oracle answers this with three mechanisms: a cumulative per-statement table
in the cursor cache, historical snapshots persisted to disk, and
one-second sampling of active sessions. Informix provides neither the
cumulative table nor the persisted history — there is no equivalent of
v$sql. It provides two live sources with opposite blind spots
and nothing that accumulates. The agent closes that gap in software.
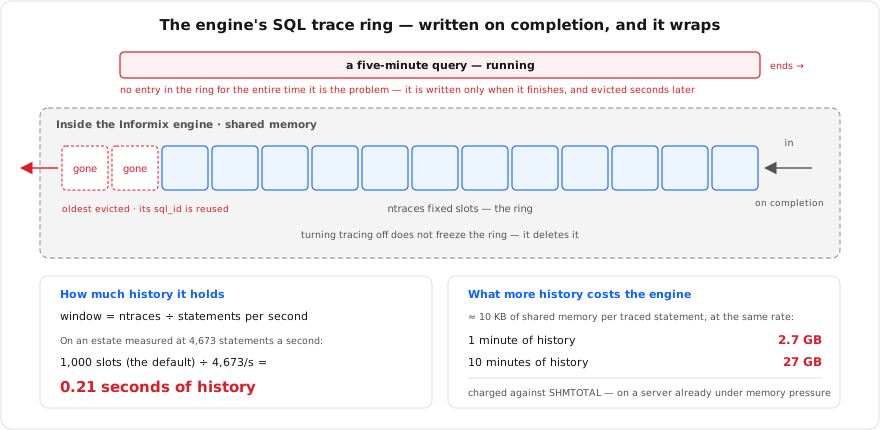
Source one — the completion ring
Source two — sampling the run queue
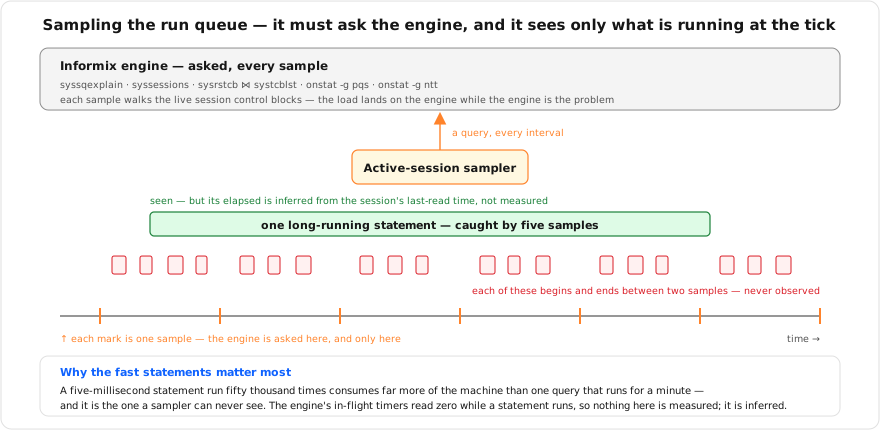
Two sources, one durable ranking
The agent runs both and merges them on the same statement fingerprint, so a single accumulated table answers both questions: which statements cost the most in aggregate, and which are running longest right now. A statement caught in flight that later completes appears on both axes, and the two corroborate each other. This is the cumulative table Informix does not provide, built where it can be held safely — in the agent, not in the engine's memory.
Reading the ring correctly is a discipline in itself. Because a full ring
evicts its oldest entry and reuses that entry's identifier, a statement read
after a wrap can return a different statement — which is how a plan ends up
attached to SQL that could never have produced it. The agent captures before
the first eviction and reads only from frozen snapshots, so a plan is always
the plan of the statement it appears under. It sizes the ring from the
server's own memory headroom and refuses a size that would put pressure on
SHMTOTAL: the instrument must never become the incident.
What each engine source can and cannot show
| Completion tracing — the ring | Run-queue sampling | |
|---|---|---|
| Records | A statement when it finishes. | What is executing at the sample instant. |
| Strong at | High-frequency short statements; exact per-execution cost; the plan the engine actually ran. | Long-running, stuck and blocked statements — the query burning an hour right now. |
| Cannot see | Anything still running, and anything older than the window. | Anything that starts and finishes between two samples. |
| Depth | Slots divided by statement rate — a fraction of a second at several thousand statements a second. | Point-in-time; a quiet instant legitimately shows nothing. |
| What it asks of the engine | Shared memory, in proportion to depth. | A walk of live session structures, on every sample. |
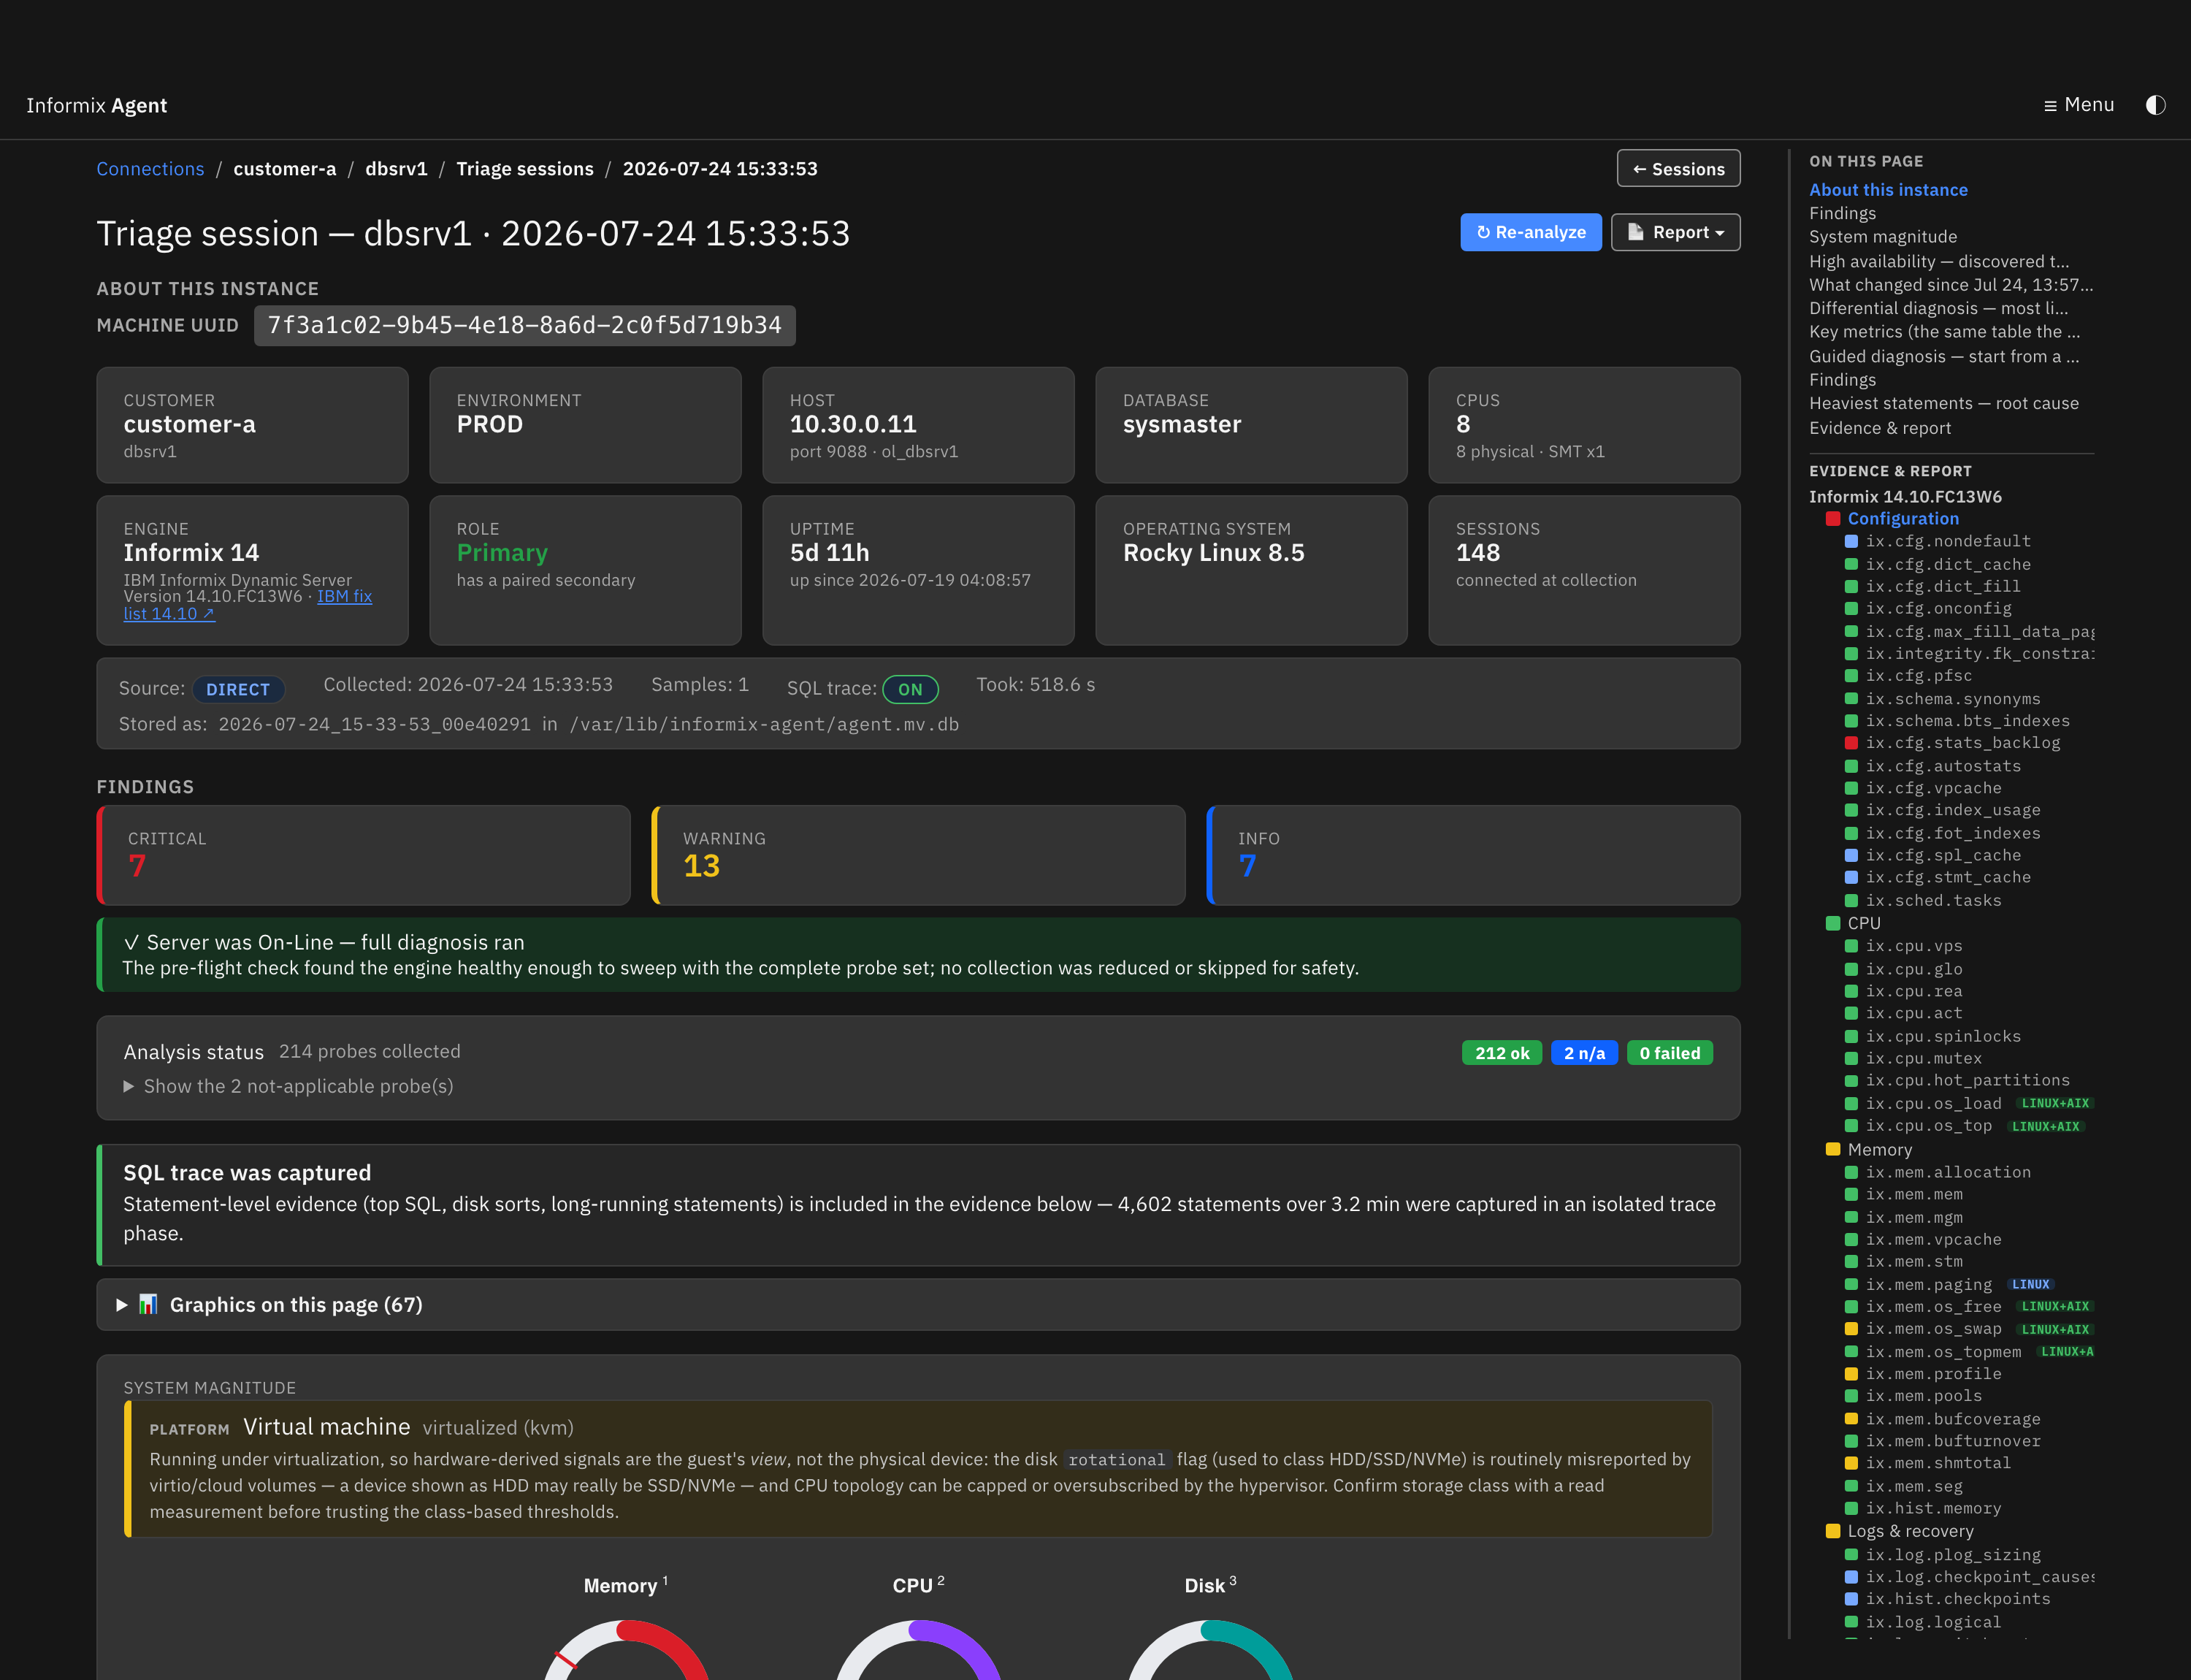
The whole diagnosis, on one screen
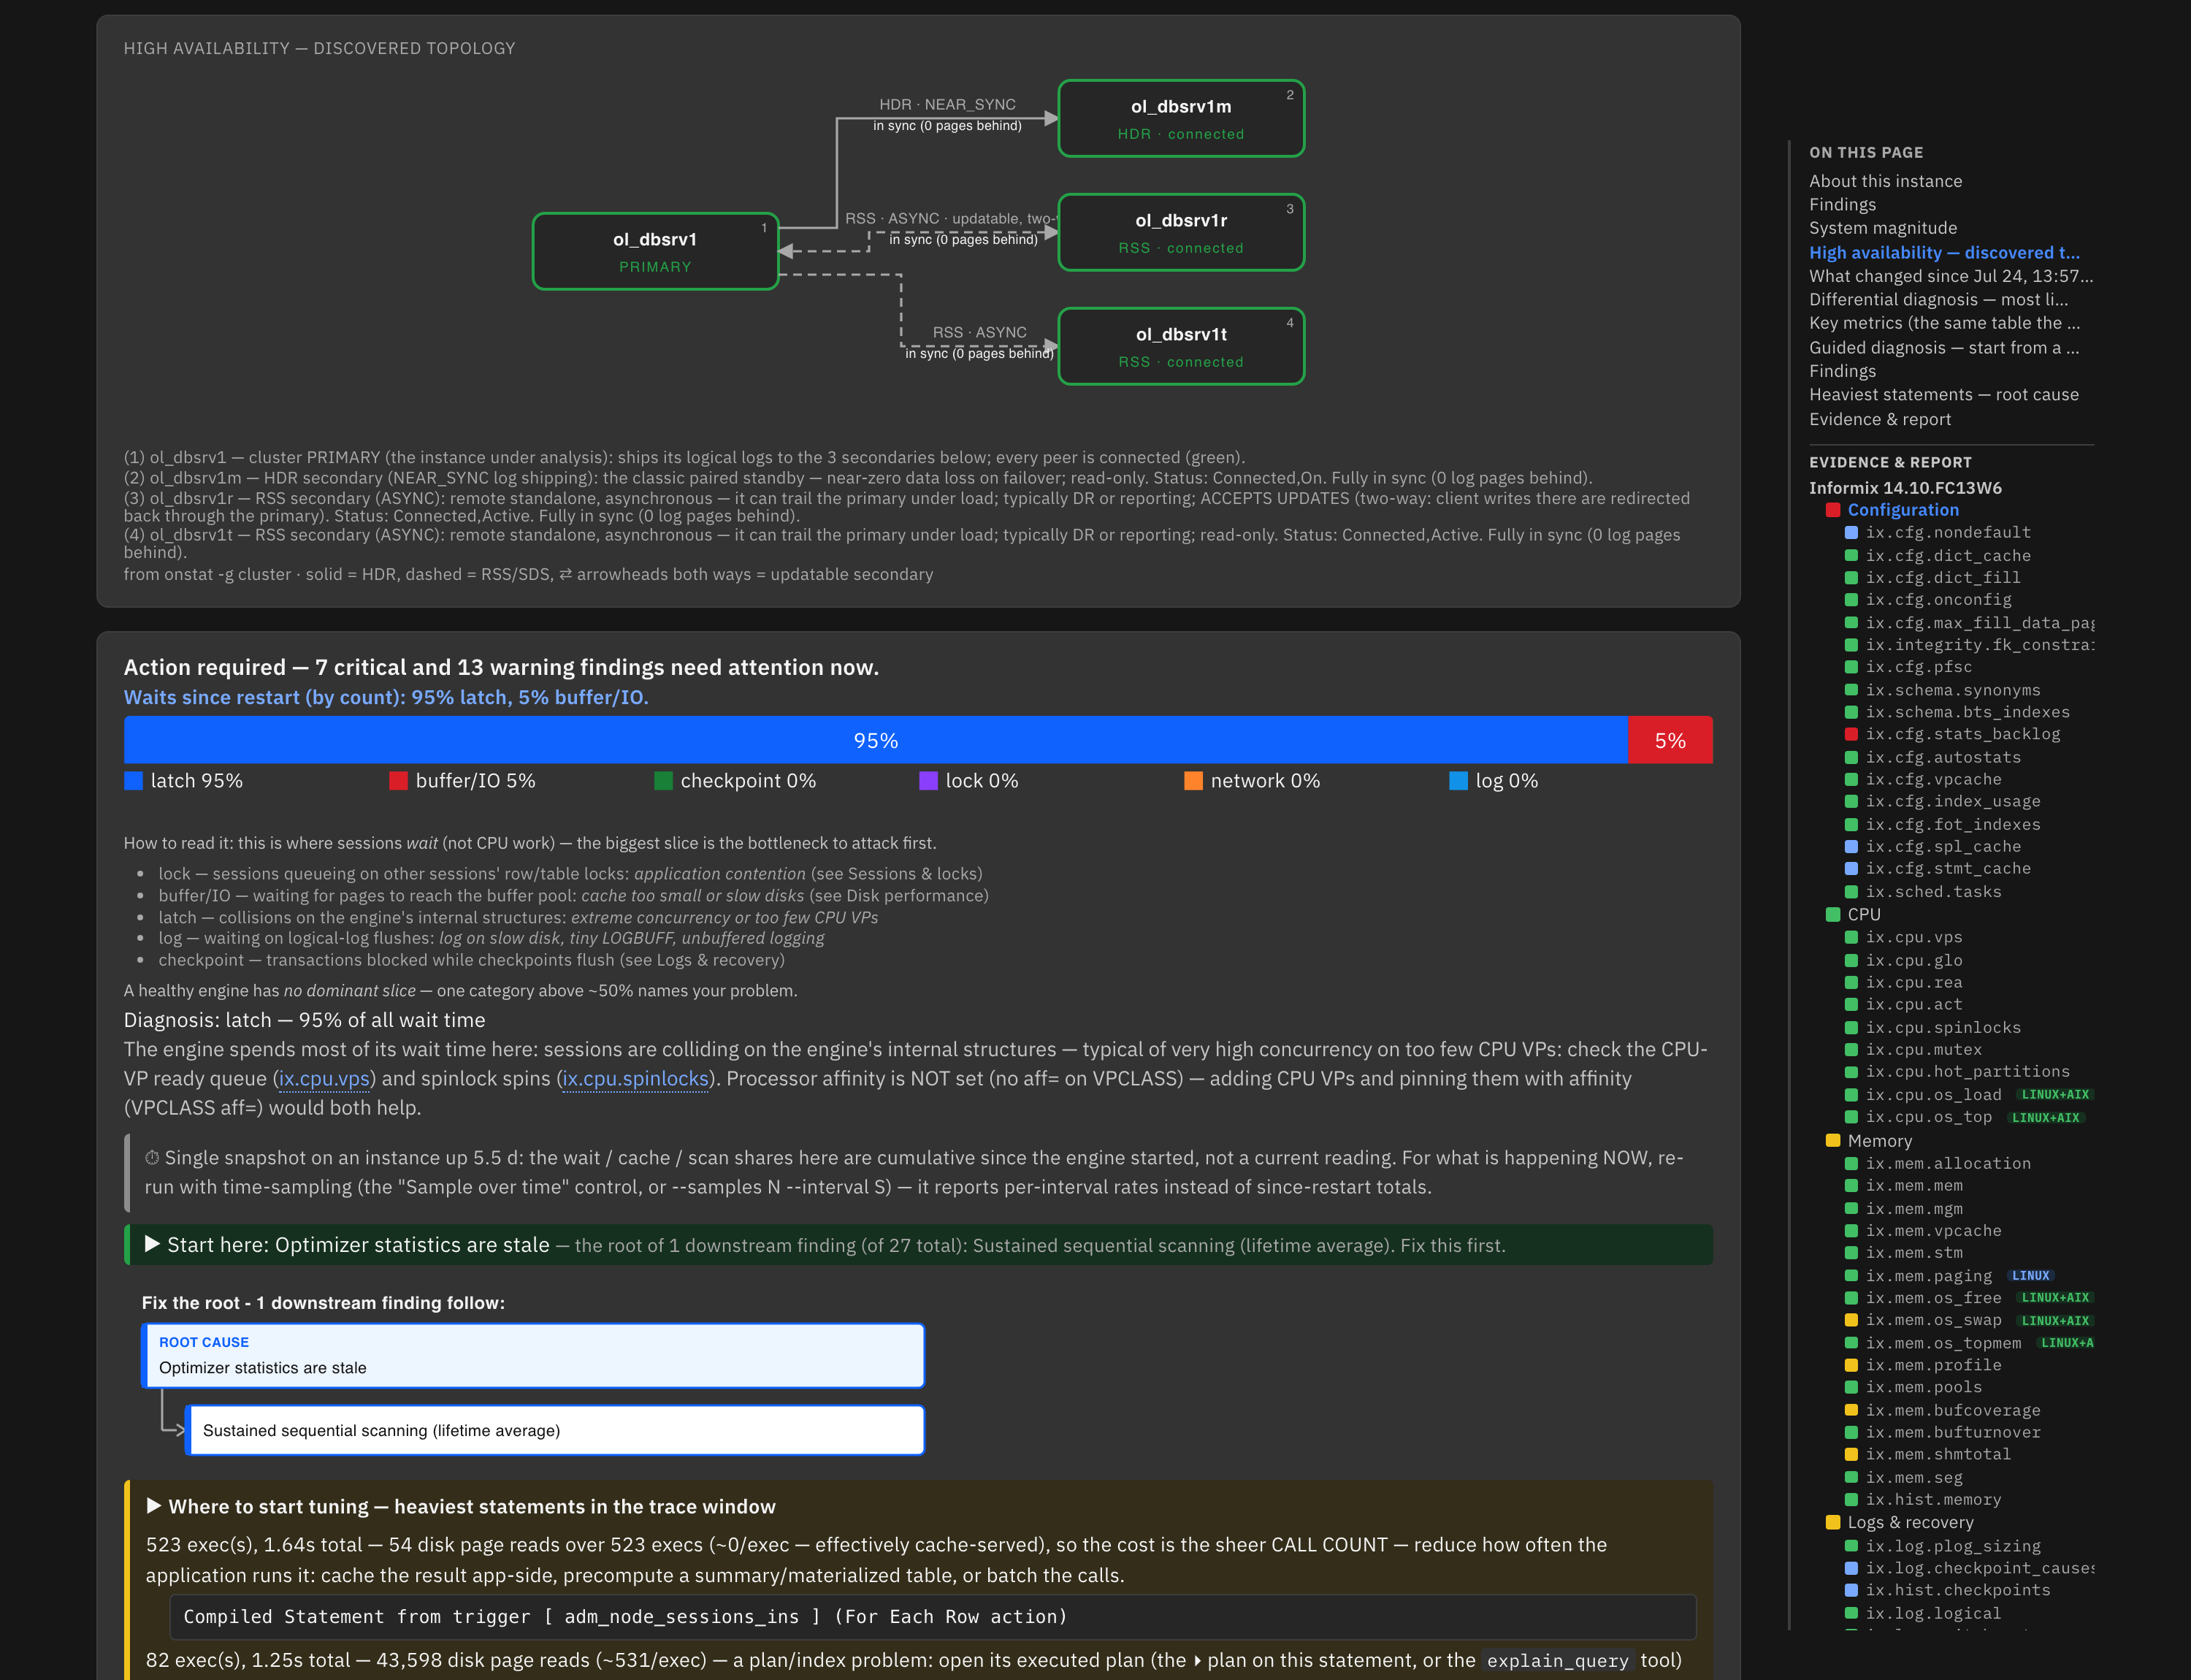
Where the engine's instrumentation reaches its limit
Both sources are read as well as they can be read, and both are bounded by what the engine records. On a busy production server the ring describes a window measured in seconds, sampling resolves only what lands on a tick, and the engine's in-flight timers read zero until a statement completes. Between the two lies a band — statements of a few hundred milliseconds, executed thousands of times an hour — too brief for a sampler to catch and too ordinary to survive the ring. That band is where most application-level performance problems live.
Measuring those statements means measuring them somewhere other than inside the engine. That is the SQL wire-tap: it reconstructs every statement from the conversation on the network, running or finished, and asks the engine for nothing — no trace buffer, no sampling load, no connection. The agent establishes whether the estate is healthy and who is connected to it; the wire-tap identifies precisely which statement is spending the machine.
From symptoms to a primary suspect
The rules read structured metrics, never scraped command text: cache and lock figures from the engine's own profile views, space from the chunk views, host numbers from the operating system. Each rule produces a finding with the evidence it was drawn from and a concrete recommendation, ranked by severity.
The analysis then goes one step further than a checklist. It ranks the findings causally — how far upstream each symptom sits — to name a primary suspect rather than a flat list, and it runs a self-check: a coherent triage is badged confident, while an incoherent one still alerts but is tagged low-confidence, so the report says how much to trust it.
Agentic operations over MCP
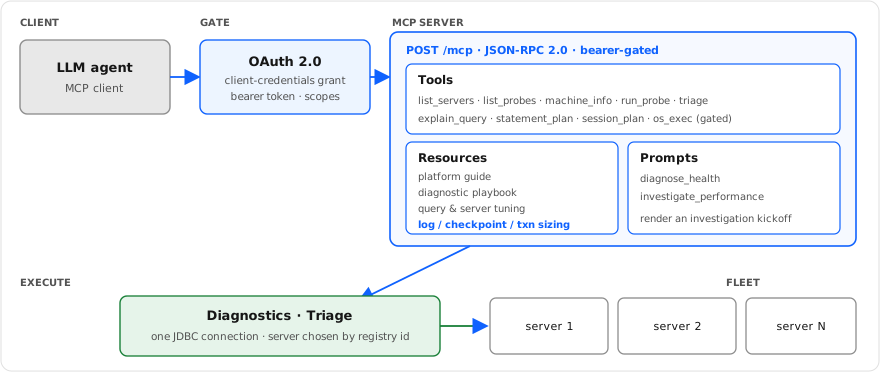
Agentic, and governed by construction
The same process that serves the console exposes the diagnostics over the Model Context Protocol. An AI agent authenticates with an OAuth 2.1 bearer token and calls typed tools — list the servers, list the probes, read the machine, run a probe, run a full triage, profile a statement — each targeting a server by its registered id. The engine's own guidance ships with it: MCP resources carry a platform guide and a diagnostic playbook, and prompts frame how to investigate, so the agent learns the tools and the method and then works a problem on its own.
Agentic does not mean unbounded. Access is a scoped bearer token, not a shell; every call is a typed tool against a named server; and host command execution is gated off by default and announced when enabled. The agent operates inside the perimeter, through the control plane — not above it.
Across the whole estate
A browser console registers every monitored server and stores each credential encrypted at rest with AES-256-GCM. Machine dashboard and full triage run per server, from one place.
Continuously, with signal
Run periodic triage across every server; it alerts only when a finding is new since the last cycle, so a steady-state issue is raised once, not every five minutes.
Captured and re-analysable
Every run is persisted — raw data, analysis and report — so a triage can be re-examined offline, without reconnecting to a production system to look again.
Informix 12, 14 and 15
The probe catalogue is version-portable and swept against every supported engine; a probe that does not apply to a given version is reported as not-applicable, never as an error.
Manual DBA triage and the diagnostic agent
| Manual triage | The diagnostic agent | |
|---|---|---|
| Who runs it | A scarce senior Informix DBA, logging into the host by hand. | ✓ Anyone, or an AI agent — the expertise is in the rules engine. |
| Coverage | Whatever commands that person remembers to run under pressure. | ✓ 208 probes across 19 categories, run the same way every time. |
| What the numbers mean | Lifetime-since-boot counters, read and interpreted live. | ✓ Interval rates and current cache hit-rates, sampled over a window. |
| Result | Expertise in one person's head, correlated from memory. | ✓ Ranked findings with evidence, remediation and a primary suspect. |
| Across many servers | Repeated, server by server, by the same scarce person. | ✓ One console for the fleet; continuous triage that alerts on new findings. |
| Automation | A human at a terminal; nothing an agent can drive. | ✓ Typed MCP tools an agent calls under a scoped OAuth token. |
Safe to point at production?
Is it safe to run against a live production server?
Yes. It is read-only, runs as the unprivileged database user, and keeps a minimal, self-cleaning footprint on the server. It reads statistics; it does not change data, schema or configuration. The handling and retention of what a run collects is set out in the trust centre.
Does it install anything on the server, or need SSH?
No. It works over the JDBC port that is already open. Host metrics — CPU, memory, swap, disk, logs — are read on the server host as the database user through the connection itself, so there is no host login and nothing to install.
What privileges does the connecting user need?
Database System Administrator rights, which let it call the SQL Administration API and read the host through the engine's own mechanism. No operating-system account and no root access.
Does it replace our DBA?
It encodes the routine triage a DBA performs — the disciplined first read, ranked and explained — so a team without a full-time Informix specialist can act, and a specialist starts from a correlated report rather than a blank terminal. Deep judgement calls remain a human's; this removes the repetitive first hour, and repeats it consistently across the estate.
How is the AI-agent access secured?
The MCP endpoint is gated by OAuth 2.1 client-credentials and a scoped bearer token. The agent calls typed tools against a named server; it does not get a shell. Host command execution is a separate capability that is off by default and announced when enabled.
Can it monitor many servers continuously?
Yes. The console registers a fleet with encrypted credentials, and a continuous mode runs periodic triage across every server, raising a finding only when it is new since the previous cycle.
Which Informix versions are supported?
Informix 12, 14 and 15. The probe catalogue is version-portable and verified against each engine; a probe whose object does not exist on a given version is reported as not-applicable rather than as a failure.
How does this compare with Oracle AWR and ASH?
It is the same two-source method, built for an engine that does not ship it. Oracle keeps a cumulative per-statement table, persists historical snapshots, and samples active sessions once a second. Informix has no cumulative statement table and no persisted history — only a fixed completion ring and live run-queue views. The agent reads both and accumulates them into one durable ranking, so an Informix estate gets the analysis an Oracle DBA takes for granted.
What does SQL tracing cost the engine, and how do you keep it safe?
The trace ring is held in the engine's shared memory at roughly 10 KB per traced statement, and its depth is its slot count divided by the statement rate. The agent sizes it from the server's own memory headroom, refuses a size that would put pressure on SHMTOTAL, captures before the ring evicts anything, and reads only frozen snapshots — so the ranking is trustworthy and the instrument never becomes the incident.
What if the bottleneck is a specific SQL statement?
That is the wire-tap's question. This agent profiles statements from the engine's own instrumentation — the completion ring and the run queue — which is bounded by what the engine records: a window of seconds on a busy server, and nothing measured while a statement runs. The wire-tap measures every statement off the network instead, running or finished, and ties each to its client. Use the agent to establish health and attribution across the estate; use the wire-tap when the question is which statement is spending the machine.