See exactly where your Informix time goes.
It is usually the hardest thing to find: which statements are actually costing the time, and which application or user is driving them. The wire-tap reads the Informix SQLI protocol straight off the network — passively, with zero load on the engine — and reconstructs every statement, and every transaction, with its real client-observed timing. The costliest operations rank to the top on the evidence of what actually happened, each tied to the user, database and application that issued it. It uses none of the engine's built-in SQL trace: nothing is enabled, nothing is consumed on the server, and the queries still running are visible as they run.
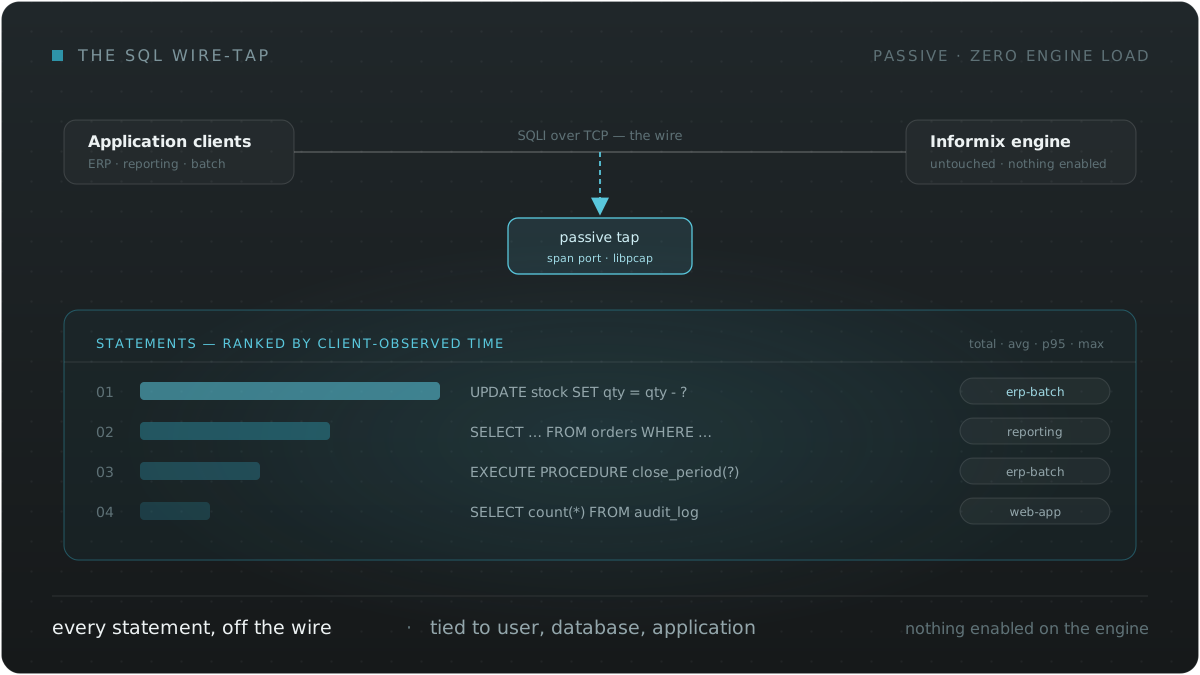
Top consumers, at a glance
The heaviest statements rank straight to the top by real observed cost — latency, bytes and executions — so the operations worth optimising are obvious, not hunted for.
Who is running what
Every statement is tied to the client host, user, database and application, so you see which app or user is driving load and exactly what SQL each one runs.
The long-runners, live
A still-running statement is visible the moment it hits the wire, with live elapsed time — not only after it completes, the way the engine trace records it.
Passive and zero-overhead
It reads a copy of the traffic from a span port; it is never in the data path and adds no load to the engine. Nothing is enabled, installed or logged into on the server.
The question is who is consuming the machine
On a server running five thousand statements a second, the CPU and the I/O are being spent by application code: a query issued inside a loop, a statement prepared on every execution, a report that scans where it could seek. None of these look like a fault. They look like a system that has become slow, and the cost is spread across millions of executions that each finish in a few hundred milliseconds — which is precisely the measurement a database is least able to make about itself.
The wire-tap measures every one of them from outside the engine and ranks by what each statement actually consumed. The answer is a named statement, a named application and a named user: the programming issue behind the slow system, rather than the symptom.
Rank it, then follow it
Open a row, read what it actually ran
Why the engine cannot answer this about itself
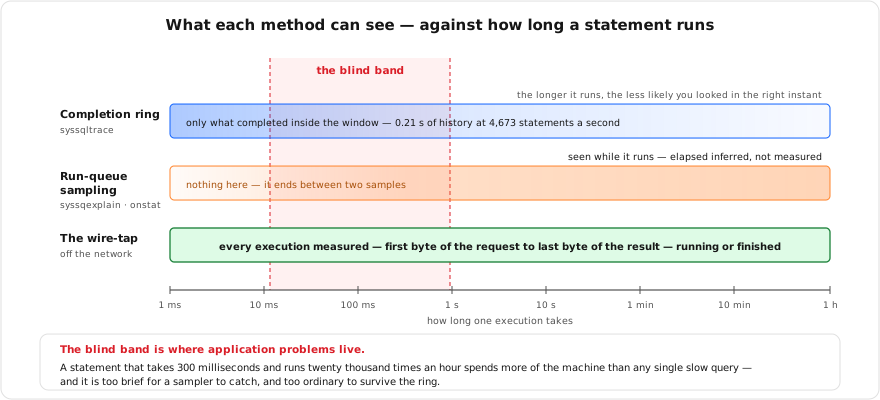
Informix offers two ways to watch its own SQL, and both were designed for a quieter machine than the one under strain. The first is the SQL trace ring: a fixed set of slots in the engine's own shared memory that records a statement when it completes. Its depth is the slot count divided by the statement rate, so on an estate measured at 4,673 statements a second the default ring holds about a fifth of a second of history. It has to be turned on, it records nothing while a statement is still running, and when it fills it discards its oldest entry and reuses that entry's slot — so a fast ring cannot even be read cleanly while it keeps moving.
The second is sampling the run queue: asking the engine, at intervals, what is executing right now. It does see the long-running query the ring cannot show — but every sample is a question put to the engine at the moment it is least able to answer, and anything that begins and ends between two samples is never observed at all. Between the two methods sits a band of statements — a few hundred milliseconds each, thousands of executions an hour — too brief for the sampler and too ordinary to survive the ring. That band is where application performance problems live.
What each method can see
Open a client, and its sessions unfold
What deeper history costs the engine — at 4,673 statements a second
| One minute of history | Ten minutes of history | The wire-tap | |
|---|---|---|---|
| Trace slots required | 280,000 | 2,800,000 | ✓ None — the engine is not asked |
| Engine shared memory | 2.7 GB | 27 GB | ✓ Zero |
| Charged against | SHMTOTAL — the same budget as buffers and sessions | SHMTOTAL — on a server already under memory pressure | ✓ The tap's own host, off the database |
| Still cannot show | Any statement while it is running | Any statement while it is running | ✓ Every statement, running or finished, from its first byte |
Measured, not sampled
The wire-tap reads a copy of the traffic off the network and reconstructs each statement from the protocol itself, so the timing comes from the bytes: the request leaving the client, the first byte of the answer, the last. Nothing is estimated, and nothing is inferred from a sample. A statement is visible the instant it reaches the wire and is followed, live, until it finishes — which is how a query that has been running for four minutes can be read at minute two rather than after it ends.
Because the accounting happens outside the engine, depth costs the server nothing. A single tap on a production estate has decoded more than 176 million statements at an average of 4,673 a second, with no packets dropped, no trace buffer enabled, no connection opened and no shared memory consumed. The same history held in the engine's own ring would have required memory the server does not have.
What it costs the database: nothing
The three ways to see the workload
| The engine's SQL trace ring | Sampling the run queue | The wire-tap | |
|---|---|---|---|
| To start it | Tracing has to be turned on — an action on the engine. | Nothing to enable — but every sample queries the engine. | ✓ Nothing on the engine — mirror the port to a passive listener. |
| Where it lives | A fixed ring in the engine's shared memory, sized in advance. | Nowhere; it is a point-in-time read of live structures. | ✓ In the tap's own process, on its own host. |
| When it records | On completion — a still-running statement has no entry yet. | Only what happens to be executing at the sample instant. | ✓ The instant a statement reaches the wire, held live until it finishes. |
| On a busy server | A fifth of a second of history at the default size; deeper costs gigabytes. | The sampling load lands on the engine that is already struggling. | ✓ 176 million statements decoded at 4,673 a second, no packets dropped. |
| Reading it at rate | Slots are reused as you read, so a fast ring cannot be captured cleanly. | Timing is inferred from a last-read timestamp, not measured. | ✓ An ordered byte stream decoded once — nothing to re-read. |
| Misses | Everything in flight, and everything older than the window. | Everything that starts and finishes between two samples. | ✓ Encrypted sessions, which are detected and skipped rather than decoded. |
How the wire-tap works
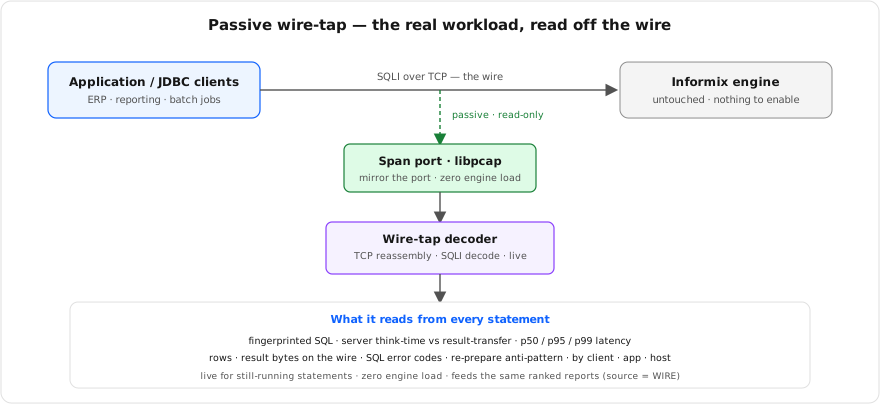
What one capture window gives you
Read off the protocol itself, so every figure is something that happened rather than something the engine estimated.
A ranking by what it actually cost
Statements are fingerprinted — literals folded to placeholders — and ranked by cumulative client-observed time, with executions, mean, p95, worst case, rows returned and result bytes beside each. The handful of statements responsible for most of the load is the first thing on the screen, not the end of a profiling project.
The statements running this instant
A statement is visible the moment it reaches the wire, with an elapsed clock that grows while you watch and the optimiser's estimated cost where the server sent one. A query four minutes into a five-minute run is readable now — the engine's own trace has no row for it until it ends.
Attribution down to the session
Every statement carries the client host, the user, the database and the application. Connections are grouped by machine and open inline to their individual sessions: how long each has been connected, how long idle, its isolation level and lock mode, its open cursors and unfreed statement handles, and what it is executing right now.
Transactions, not just statements
Statements between a BEGIN and its COMMIT or ROLLBACK are grouped per connection, with the statement and cursor counts and the wall-clock duration. Long-held transactions, cursors left open across a commit, and a rising rollback rate each read as their own signal.
Think-time against transfer
Client-observed latency split at the first response byte: how long the server took to answer, and how long the answer took to arrive. That is the difference between a slow plan and an oversized result, and it decides which one you go and fix.
Errors named, not numbered
Failures grouped by sqlcode and ranked by frequency, each named from the full Informix message catalogue, with the connection that hit it, the time, and the statement that failed. Expand a code for its last hundred occurrences — one looping job and fifty clients hitting the same constraint look identical in a count and nothing alike here.
Result volume and LOB traffic
Rows returned per execution and the bytes actually put on the wire — the "twenty rows, four megabytes each" case — plus smart-LOB write volume attributed to the statement that carried it, which no row count will ever show you.
Its own honesty, on screen
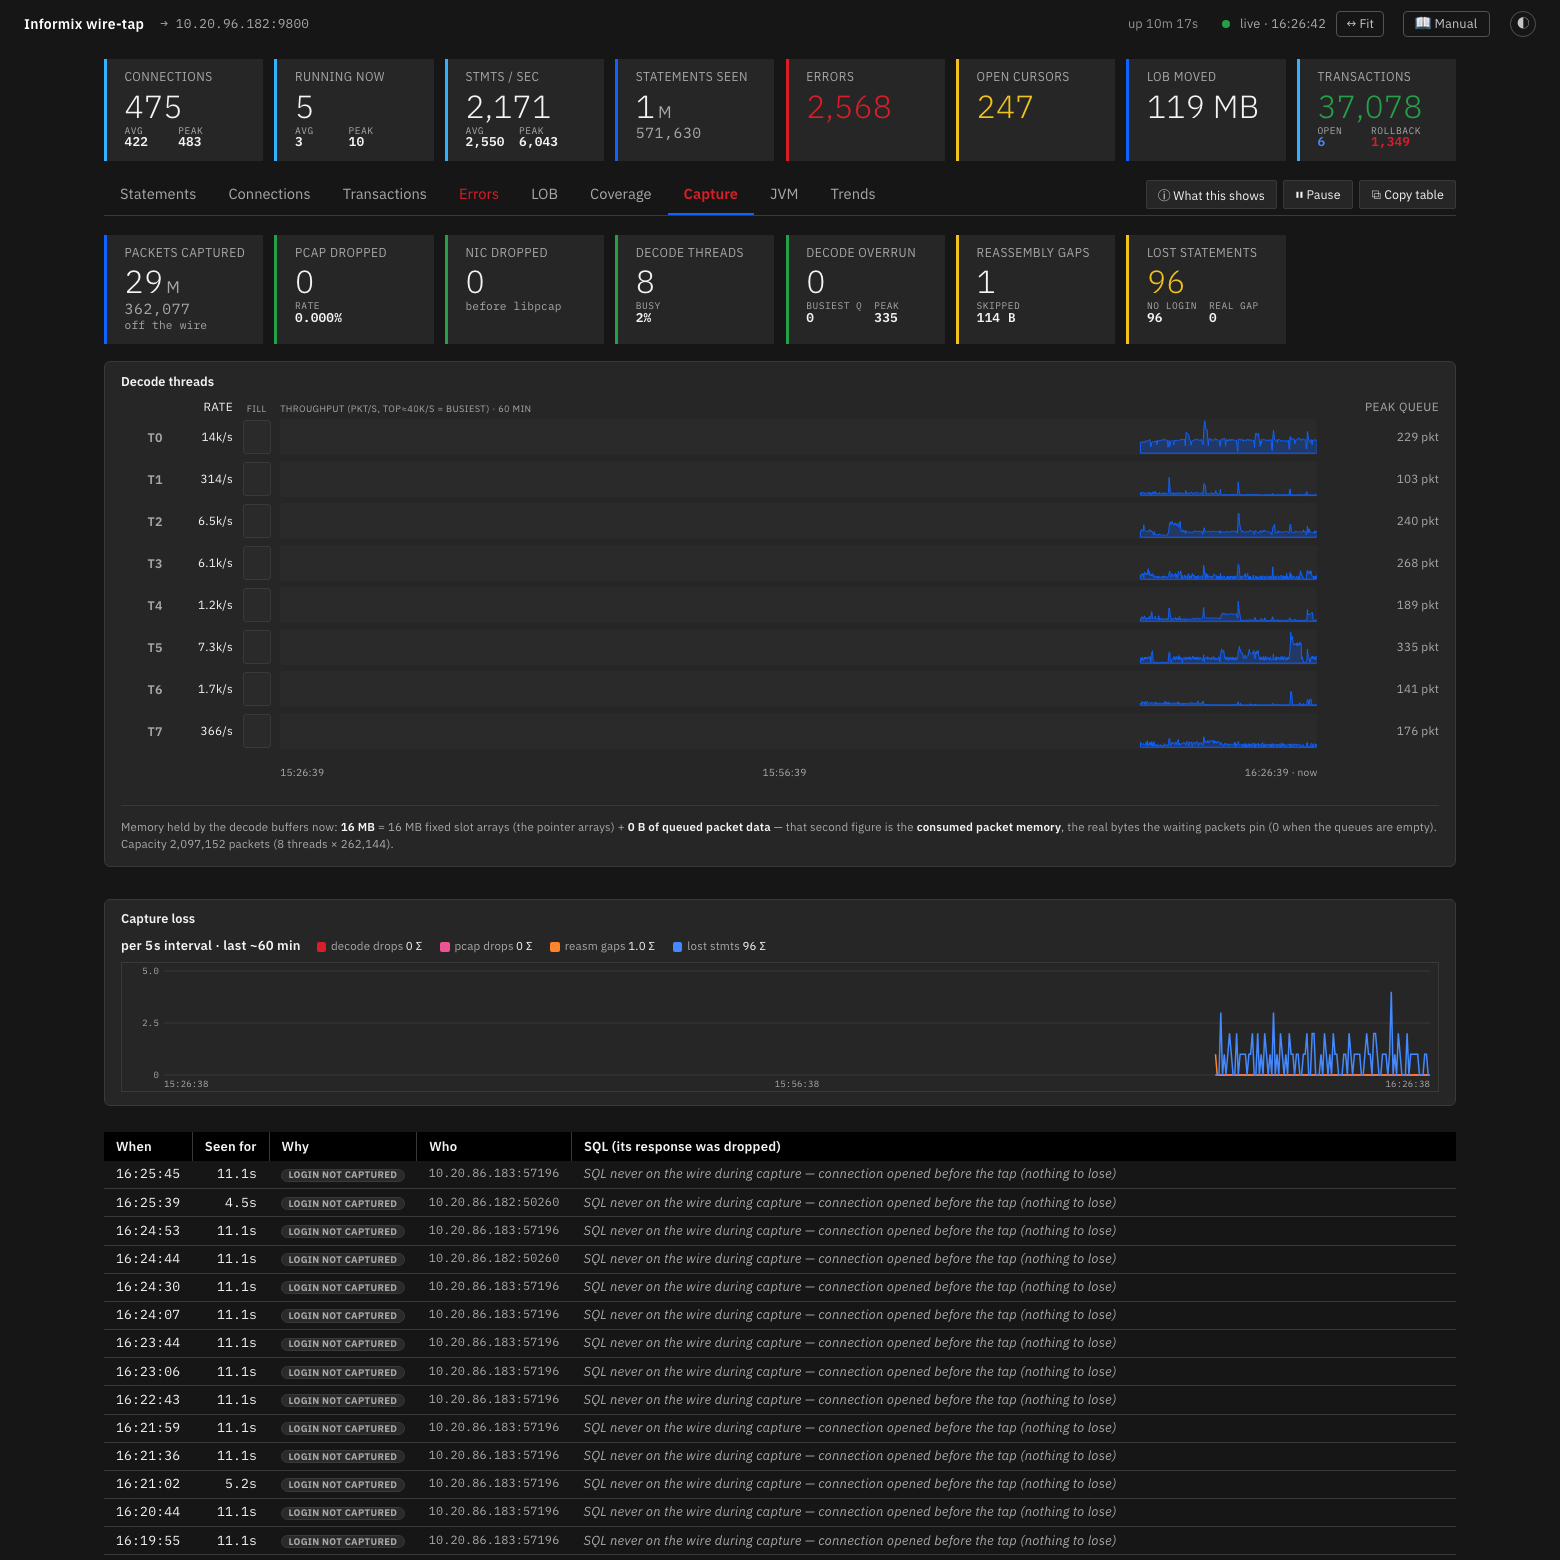
A capture-health view with packets taken, packets dropped by the NIC or the ring, reassembly gaps and per-thread decode meters; a coverage table naming every protocol path the decoder does not parse; and a self-check badge asserting the numbers cannot contradict each other. When something is missing, the tool says so rather than quietly rounding it away.
Down to the transaction, not only the statement
A slow system is often a transaction problem, not a single-statement one: a transaction held open too long, a burst of rollbacks wasting the work that preceded them, or a WITH HOLD cursor keeping a lock across a commit. The wire-tap follows the transaction opcodes on each connection — the BEGIN, the COMMIT and the ROLLBACK, including the distributed variants — and groups the statements between them, so the longest-running and heaviest transactions are ranked alongside the statements, and a rising rollback rate is visible as its own signal rather than hidden inside a statement count.
The honest boundary: only explicit transactions are grouped this way. An application that runs with autocommit on issues no transaction markers on the wire — each statement is its own implicit transaction on the server — so those are counted as statements, correctly, and not as multi-statement transactions. Where an application manages its own transactions, the wire-tap shows them in full.
A fast path to the real bottleneck
Because the ranking is real client-observed latency and real bytes on the wire — not an estimated plan cost — the costliest operations sort to the top on the evidence of what actually happened. The by-user and by-application breakdown, the think-time and transfer split, the percentile tails and the re-prepare flag turn "the system feels slow" into a named statement, a named client and a specific thing to fix. It is the view that is usually hardest to get: exactly where an application is losing its time.
It deploys off a span port for a live production read, inline for a test environment, or against a saved capture for offline analysis, and its output lands in the same ranked reports as the diagnostic agent, so the two methods read as one picture. Encrypted connections are detected and skipped rather than decoded, and statement values are reduced to placeholders — the report shows the shape of the workload, not its data.
Open an error code, and see every time it happened
The whole tool, in one pass
Passive by design.
How does the wire-tap connect — does it need database access?
No. It reads a copy of the network traffic from a switch span port, or decodes a saved packet capture after the fact. It does not log into the engine and adds no load to it; on the host it runs as an unprivileged, passive listener. For a test environment it can also sit inline as a listen-and-forward proxy.
Is it safe to run against a busy production server?
Yes — it is the safe option by construction. It never touches the engine and is never in the data path; it only reads a mirror of traffic the switch already forwards, so there is no trace buffer to turn on and no load added to a box that is already under strain.
How quickly does it find the costly statements?
The ranking is live. As traffic flows, statements accumulate by real observed cost and the top consumers rise to the top on their own — so the heaviest few, and the clients driving them, are visible in a single capture window rather than after a profiling project.
What about encrypted connections and sensitive data?
Encrypted sessions are detected and skipped, not decoded. On plain connections the wire-tap fingerprints statements — literals and bound parameter values are reduced to placeholders and never captured — so the report shows the shape of the workload, not the data flowing through it.
When would we use the wire-tap rather than the diagnostic agent?
They complement each other. The agent asks the engine and reads its whole health; the wire-tap listens to the workload and shows where time is spent, tied to the client — so it is the tool for a live production read of the costliest SQL without enabling anything on the server.
Why not just use the engine's built-in SQL trace?
The engine's SQL trace is a fixed ring in shared memory that you have to turn on. It records a statement only once it completes, and its depth is its slot count divided by the statement rate — at the default size on an estate running 4,673 statements a second, about a fifth of a second of history. Buying a minute costs roughly 2.7 GB of the engine's shared memory and ten minutes about 27 GB, charged against the same budget as the buffer pool, and neither purchase shows a statement while it is still running. The wire-tap consumes nothing on the engine, keeps every statement it sees for as long as it runs, and follows the in-flight ones live. The engine trace is still the right tool for an executed plan or a bounded window on a quieter system, which is where the diagnostic agent uses it.
What about sampling — cannot the engine simply be asked what is running?
It can, and that is the other half of what the diagnostic agent does. Sampling the run queue finds the long-running query the ring cannot show while it runs. It has two structural limits: every sample is a query put to the engine at the moment it is least able to answer, and any statement that begins and ends between two samples is never observed. Since a statement of a few hundred milliseconds executed thousands of times an hour consumes more of the machine than one long query, the statements that matter most are usually the ones sampling cannot see.
How does this compare with Oracle AWR and ASH?
Oracle keeps a cumulative per-statement table in the cursor cache, persists historical snapshots, and samples active sessions once a second — three mechanisms, so a DBA can ask what the top statements were last Tuesday afternoon. Informix has no cumulative statement table and no persisted history; the diagnostic agent builds that table itself from the two live sources the engine does provide. The wire-tap takes the other route entirely: it measures the workload on the network, so the depth of history is limited by the tap's own host rather than by the database's memory.
What does the wire-tap cost the database?
Nothing measurable, because the database is never involved. It opens no connection, enables no trace, allocates no shared memory and sends no query. On a production estate it has decoded over 176 million statements at an average of 4,673 a second with no packets dropped by the capture, all of it on its own host. The engine's only involvement is that its traffic is being mirrored by the switch, which it does not observe.
Does it show transactions, or only statements?
Both. It follows each connection's BEGIN, COMMIT and ROLLBACK — including the distributed variants — to group statements into transactions and to surface the longest-running transactions, the commit and rollback counts and the rollback rate. Only explicit transactions are grouped this way; an application running with autocommit on sends no transaction markers on the wire, so those statements are counted individually, which is correct.